
.webp)
.png)
Defining the economic value of a North Star Metric
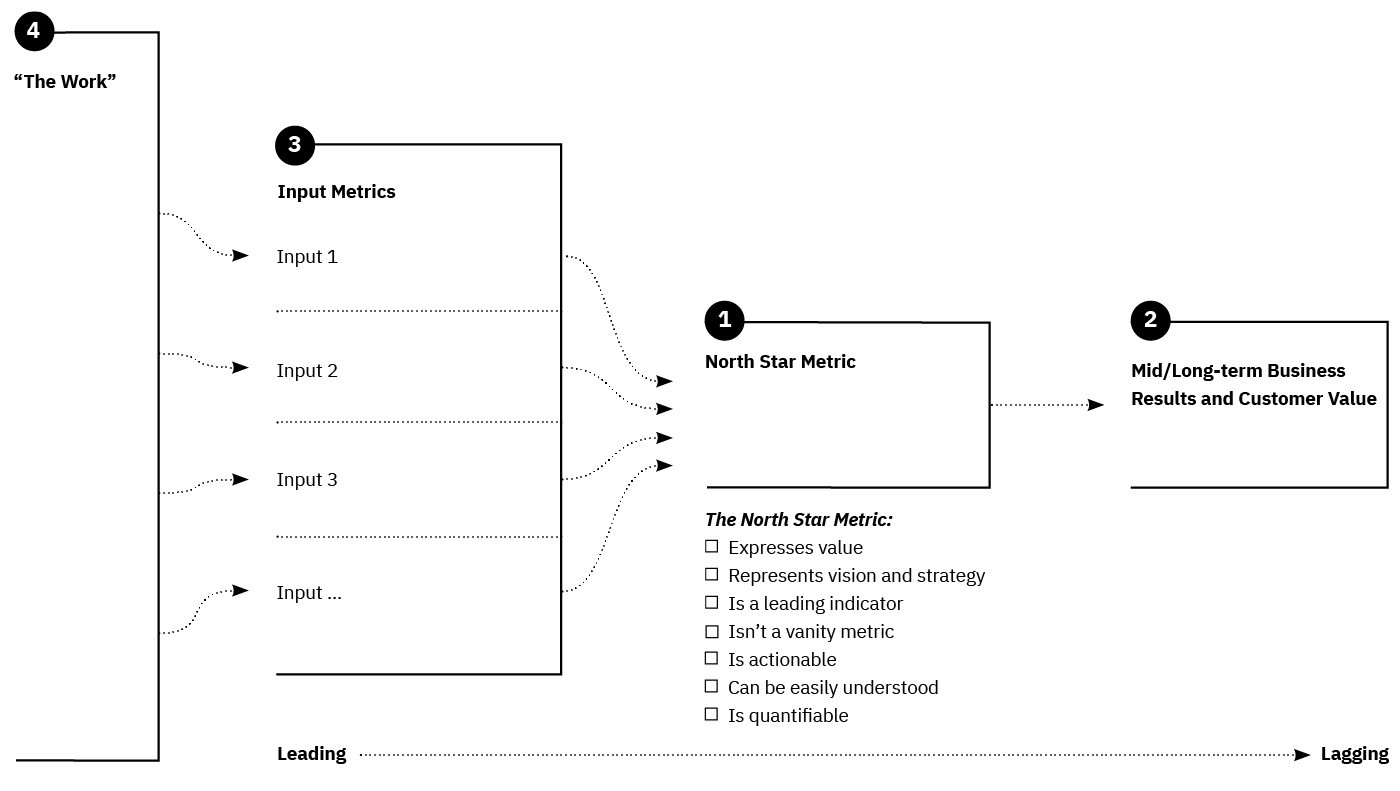
When evaluating North Star Metric framework examples, companies identify the single quantitative indicator that best captures the core value a product delivers to its customers. From a financial perspective, this metric serves as a leading indicator for revenue growth, as it aligns cross-functional teams toward outcomes that drive long-term monetization rather than vanity metrics like raw page views or sign-ups.
When a company optimizes for its NSM, it effectively reduces churn and increases the efficiency of customer acquisition costs (CAC).
Connecting user retention to lifetime value
The financial impact of a North Star Metric is most visible when analyzing the relationship between user retention and Customer Lifetime Value (LTV). By identifying the specific action that correlates with long-term usage, businesses can engineer their product experience to maximize the duration of the customer relationship.
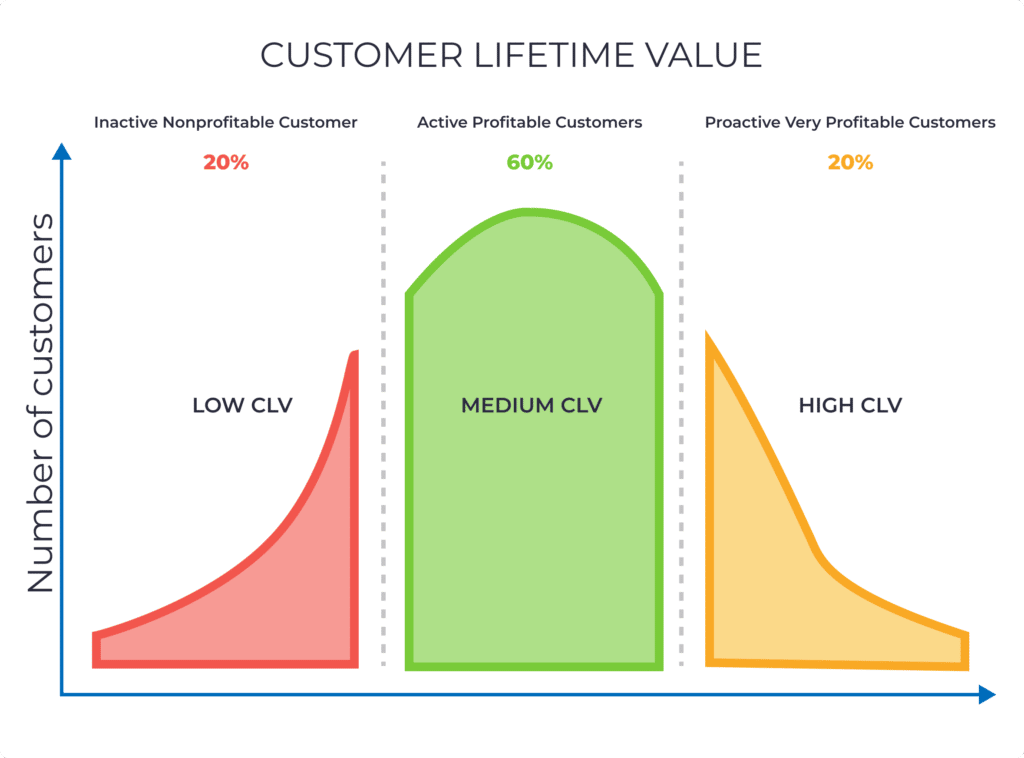
The calculation is straightforward: as retention rates improve, the denominator in your CAC-to-LTV ratio becomes more favorable, directly expanding the profit margin per user. For example, if a SaaS platform identifies that users who complete an integration within their first 48 hours have a 30% higher retention rate, that integration completion becomes the North Star.
By focusing engineering and onboarding resources on this specific task, the company increases the cohort's average LTV. If the average LTV of a retained user is $500 and the churned user is $150, every percentage point increase in retention directly translates to a measurable expansion in recurring revenue without requiring additional marketing spend.
This framework forces a shift in capital allocation. Instead of pouring budget into top-of-funnel acquisition to compensate for a leaky bucket, leadership can justify investments in product features that deepen user engagement. This shift transforms the product team from a cost center into a primary driver of sustainable, compounding revenue growth.
Operational costs of implementing North Star Metric framework examples
Adopting a North Star Metric (NSM) requires more than just selecting a high-level KPI; it demands a significant investment in data architecture and cultural alignment. Companies often underestimate the hidden costs associated with shifting from vanity metrics to a single, actionable North Star that reflects customer value.
These expenses typically manifest as technical debt, specialized headcount, and the friction of cross-departmental retraining.
Infrastructure and data engineering overhead
Tracking a true North Star Metric requires a robust data pipeline that can handle real-time event streaming and complex attribution. If your current stack relies on fragmented silos, you will likely need to invest in a Customer Data Platform (CDP) like Segment or mParticle to unify user touchpoints.
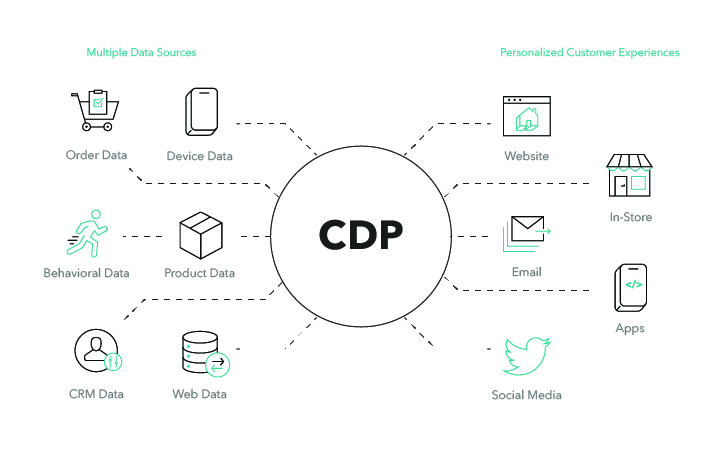
Engineering teams must spend weeks, if not months, instrumenting product analytics tools such as Amplitude or Mixpanel to ensure the data feeding your NSM is accurate and deduplicated. The financial burden extends to data hygiene. Cleaning historical data to establish a reliable baseline often requires dedicated data engineering hours.
Organizations should budget for the ongoing maintenance of these pipelines, as drift in tracking logic can lead to incorrect metric reporting, which defeats the purpose of the framework. Expect to allocate at least 15-20% of your initial implementation budget toward infrastructure hardening and automated quality assurance testing.
The cost of organizational change management
The most significant, yet frequently overlooked, cost is the human capital required to pivot an entire organization toward a new focal point. When teams are accustomed to measuring success via output-based metrics—such as feature releases or total sign-ups—shifting to an outcome-based NSM requires intensive change management.
This involves creating internal documentation, hosting workshops, and potentially hiring external consultants to facilitate the transition. Budgeting for this transition should include the cost of internal communication campaigns that reinforce the NSM across all levels of the company.
You must account for the temporary dip in productivity as teams realign their roadmaps and abandon legacy projects that do not contribute to the new metric. If your organization lacks a centralized product operations function, you may need to invest in new leadership roles to oversee this cultural shift. Failing to fund these communication and training efforts often results in the NSM becoming a hollow executive mandate rather than a functional tool that drives daily decision-making.
Calculating ROI for metric-driven product development
Quantifying the financial return of the North Star Metric (NSM) framework requires moving beyond vanity metrics and mapping product improvements directly to revenue or cost-saving outcomes. When a team aligns its output with a singular, value-based metric, the primary ROI manifests as a reduction in the opportunity cost of building features that do not move the needle.
Measuring efficiency gains in feature prioritization
To track the reduction in wasted development hours, establish a baseline for your 'feature-to-impact' ratio before implementing the framework. Calculate the total engineering and design hours spent on features that failed to produce a statistically significant change in your core business KPIs over the previous six months.
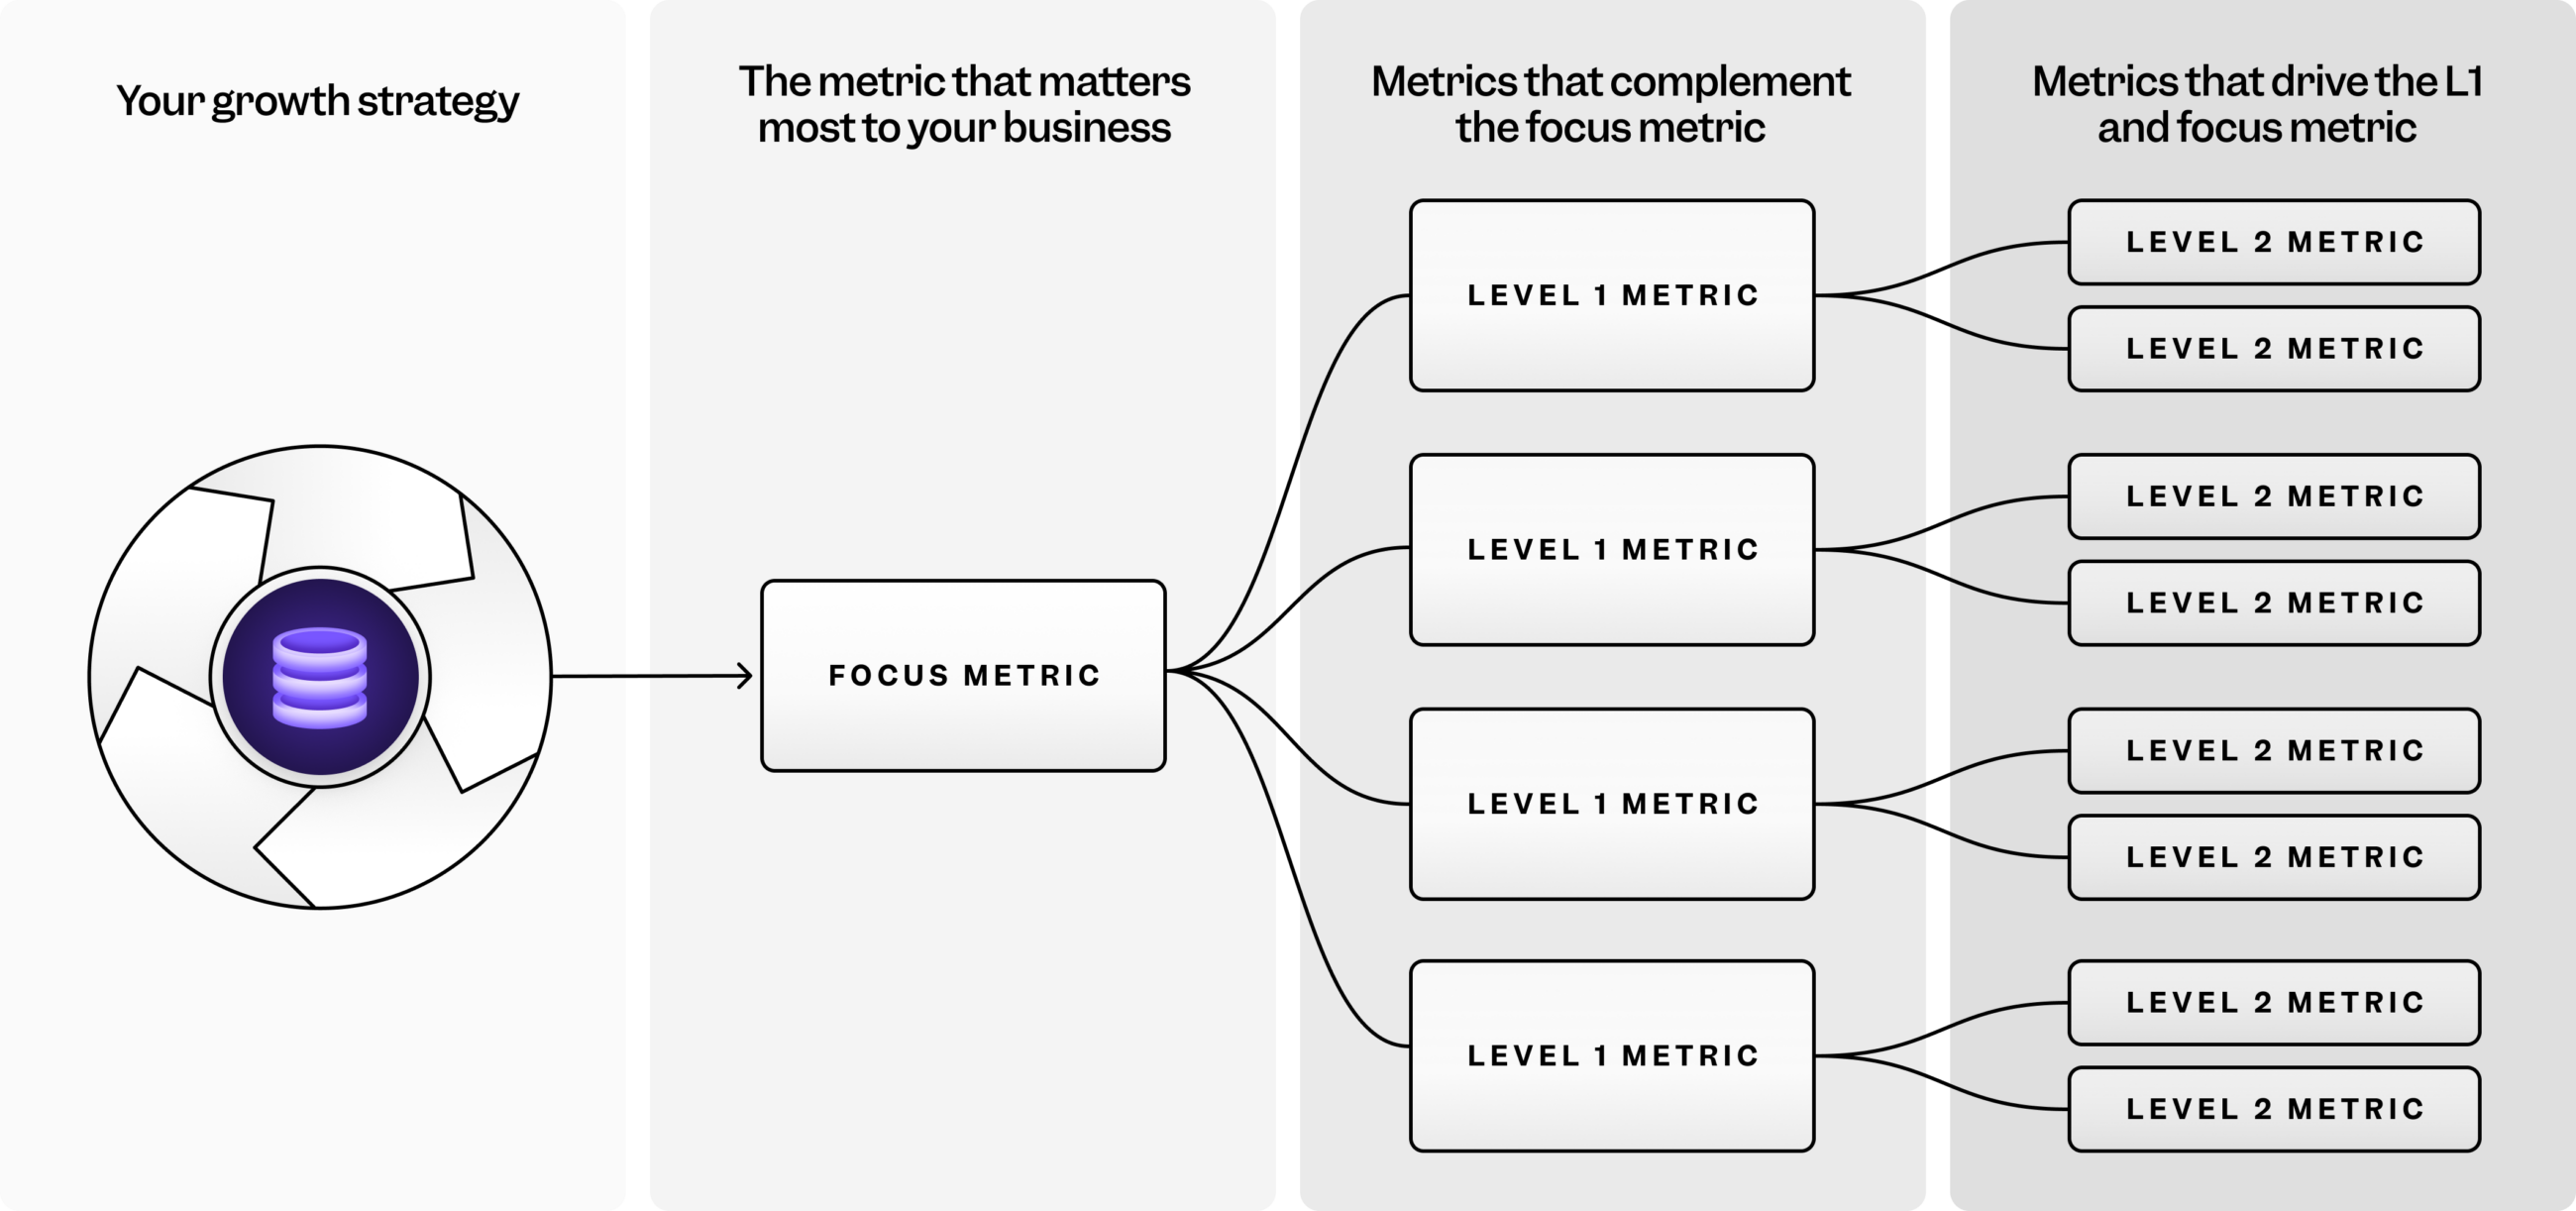
By applying the North Star Metric framework examples, such as Spotify’s 'Time Spent Listening' or Airbnb’s 'Nights Booked,' teams can filter out low-impact backlog items. Use the following formula to measure efficiency gains:
- Baseline Waste: (Total hours spent on features with <1% impact on core KPI) / (Total development hours).
- Post-NSM Waste: Repeat the calculation after the framework is adopted.
- Efficiency Delta: The difference represents the reclaimed capacity, which can be monetized by multiplying the saved hours by your average fully-loaded engineering hourly rate.
This approach forces a rigorous 'kill-switch' mentality. If a proposed feature does not have a clear, measurable path to influencing the North Star Metric, it is deprioritized or discarded. This discipline prevents the 'feature creep' that often plagues scaling startups, where engineering resources are spread thin across disparate, low-ROI initiatives.
By focusing exclusively on the North Star, you maximize the utilization of your most expensive asset—your engineering talent—ensuring that every sprint cycle contributes directly to the bottom line rather than simply adding complexity to the product surface area.
Strategic trade-offs in metric selection
Selecting a North Star Metric requires balancing long-term customer value against short-term operational overhead. When evaluating North Star Metric framework examples, teams often fall into the trap of tracking vanity metrics that look impressive on a dashboard but fail to correlate with revenue growth or user retention.
A high-impact metric must be actionable, meaning it directly influences product development cycles and resource allocation. For instance, a SaaS company might choose "Daily Active Users" as a primary metric. While easy to track, it may mask churn if the product is not providing sustained value.
A more strategic choice would be "Time to First Value," which forces the engineering and product teams to optimize the onboarding experience, directly impacting customer lifetime value (CLV) and reducing acquisition costs.
Mitigating high-cost, low-impact tracking
Data collection is not free. Every event tracked in tools like Segment, Mixpanel, or Amplitude incurs costs related to engineering time, storage, and data processing. Identifying when the cost of data collection exceeds the value of the insight is critical for maintaining a healthy ROI on your analytics stack.
To determine if a metric is worth the investment, apply the "Decision-Velocity Test." Ask whether the data point changes a specific product decision within a 30-day window. If the team is tracking granular user behavior that never leads to a feature iteration, marketing pivot, or pricing adjustment, the data is essentially noise.
This is particularly common in early-stage startups that attempt to track every click without a clear hypothesis. Consider these indicators that your tracking strategy is over-engineered:
- Data hoarding: You store terabytes of event logs that no one on the product team has queried in the last quarter.
- Engineering friction: Developers spend more than 10% of their sprint capacity maintaining tracking code rather than building core features.
- Insight paralysis: The dashboard contains more than five primary metrics, making it impossible for the team to prioritize which lever to pull to drive growth.
Focusing on a single, high-impact North Star Metric reduces the noise and ensures that engineering resources are directed toward features that demonstrably improve the user experience. By pruning irrelevant tracking, companies lower their technical debt and gain clarity on the metrics that actually move the bottom line.
Real-world financial outcomes from North Star adoption
Organizations that successfully implement a North Star Metric (NSM) often report a direct correlation between focused product development and improved customer lifetime value (CLV). By aligning engineering, marketing, and sales teams around a single unit of value, companies reduce the 'feature factory' trap—where resources are wasted on low-impact updates.
For instance, when a SaaS platform shifts its focus from daily active users to 'successful task completion,' the reduction in churn often yields a 15-20% increase in annual recurring revenue within three fiscal quarters.
Comparative analysis of B2B versus B2C metric ROI
The financial payoff of North Star Metric framework examples varies significantly depending on whether the business model relies on high-volume transactions or high-touch enterprise contracts. In B2C environments, the NSM often centers on engagement frequency or viral loops.
A mobile app measuring 'time spent in-app' can correlate this directly to ad inventory value and subscription conversion rates. The ROI here is realized through incremental gains in user retention, which compounds quickly across a massive user base.
Conversely, B2B models prioritize metrics like 'time-to-value' or 'number of active seats per account.' Because B2B sales cycles are longer and acquisition costs are higher, the financial impact of an NSM is measured by the reduction in churn and the expansion of existing accounts.
A B2B firm that optimizes for 'successful onboarding completion' typically sees a shorter payback period on Customer Acquisition Cost (CAC). While B2C ROI is driven by scale and volume, B2B ROI is driven by account expansion and long-term contract stability.
Businesses that fail to distinguish between these models often select vanity metrics that look good on a dashboard but provide zero visibility into actual cash flow or margin improvement. Ultimately, the financial success of this framework depends on the ability to link the chosen metric to a specific P&L line item. If the metric does not influence a driver of revenue—such as churn rate, upsell velocity, or acquisition efficiency—it remains a theoretical exercise rather than a strategic financial tool.
Frequently Asked Questions
Methodology for calculating North Star Metric ROI
ROI is calculated by measuring the delta in customer lifetime value (CLV) or reduced churn costs directly attributable to the behavioral changes driven by your North Star Metric, minus the implementation and tracking overhead.
Common North Star Metric framework examples for SaaS
Common examples include 'Time to First Value' (TTFV) for onboarding efficiency, 'Daily Active Users' for retention, or 'Number of Paid Seats Added' for expansion revenue. If you are looking to scale your development, you might also explore the best AI agent framework for development to streamline your engineering output, or review current SaaS product management frameworks to better align your team's delivery cycles.

